Ruiqing Zhao
Welcome!
I had four years of study in the field of industrial design, and then gradually learnt about interaction design and experience design. I believe that better interaction design is an important factor in achieving a better life.

Welcome!
I had four years of study in the field of industrial design, and then gradually learnt about interaction design and experience design. I believe that better interaction design is an important factor in achieving a better life.


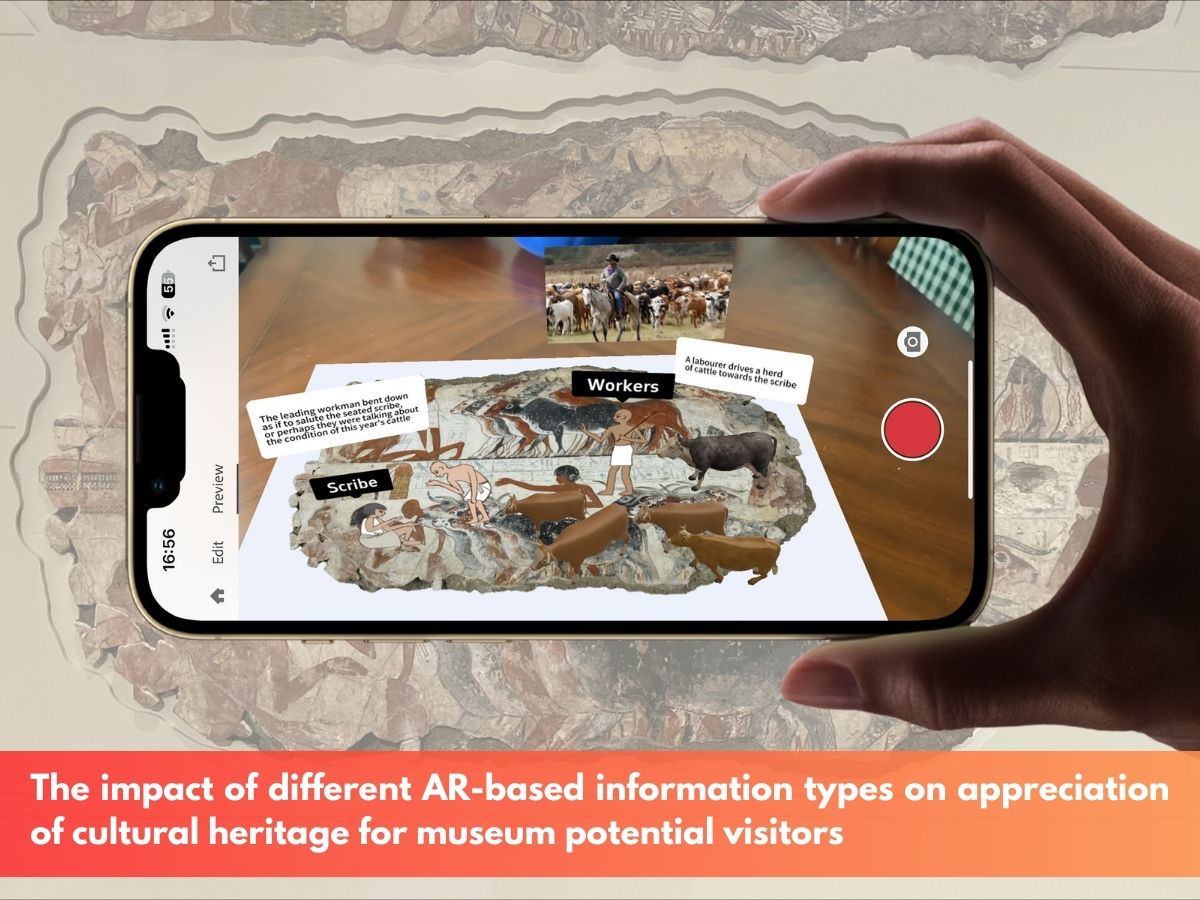
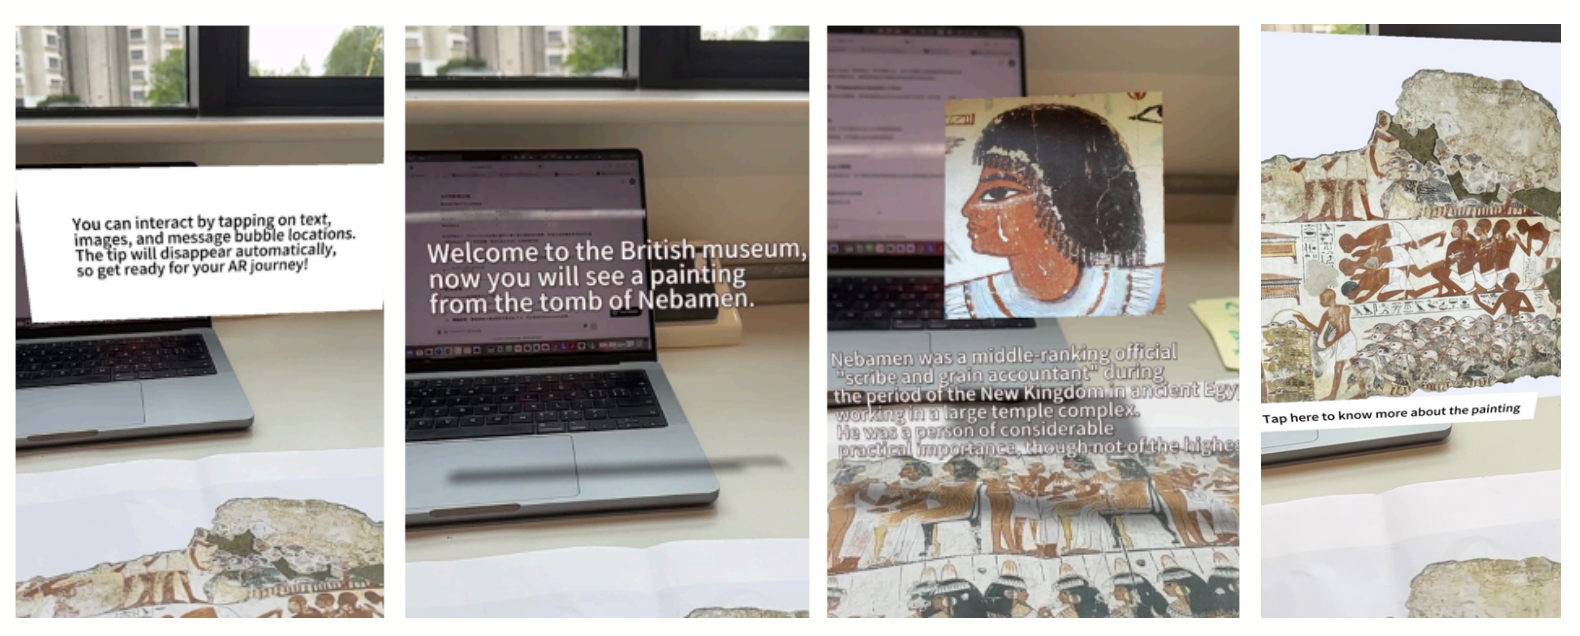
In the empathize and define stage, four different design prototypes were selected for this study through the existing literature (as shown in the figure). The whole prototypes were presented through printings and Adobe Aero software. The devices used in this project are mobile devices such as mobile phones and ipads.
In the testing stage, the first version of the prototype is tested by both self-simulation and pilot test. To find out some design problems and unfriendly interactions. The main ways of improvement are:

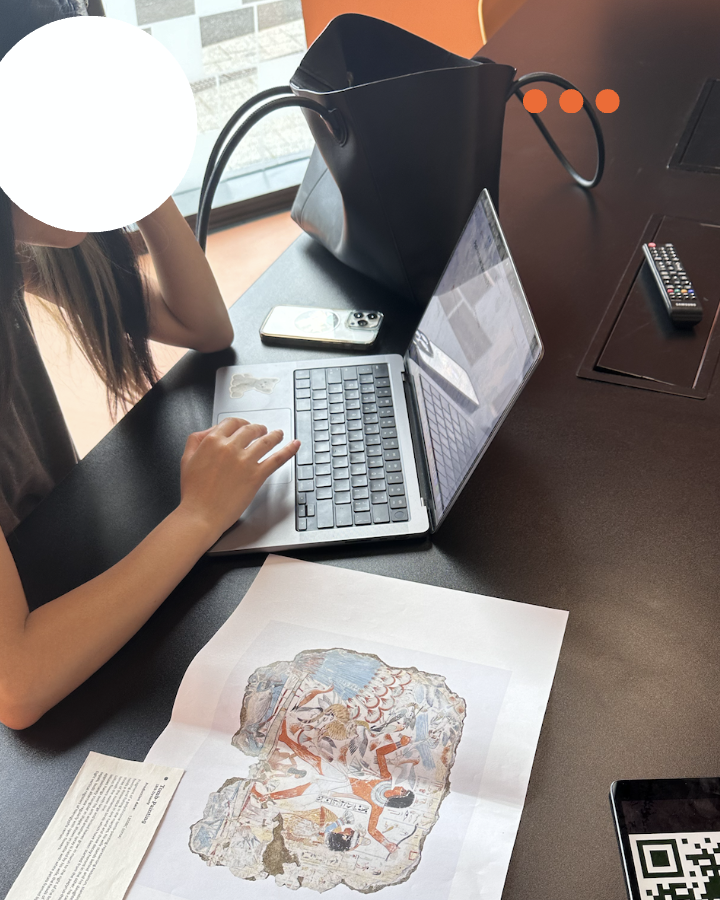
A total of 30 people were recruited to participate in this experiment.
I used Intrinsic Motivation Inventory, SUS, User engagement scale short form, and self-written questionnaire to collect qualitative data from the participants about interest, perceived usability, engagement, and understanding dimensions.
Qualitative data were analyzed by SPSS for descriptive analysis and significance tests; quantitative data were analyzed by thematic analysis methods.
| Questionnaire | Descriptive statistics | Significance analysis |
| Interest-Intrinsic Motivation Inventory | Count the MEAN values of the results. | Data were not normally distributed and using the Friedman’s test and Wilcoxon test |
| Comprehension-Self-written questionnaires | Counting the percentage of correctness. | Data were not normally distributed and using the Friedman’s test and Wilcoxon test |
| Perceived usability-SUS | Converting the scale scores into a total score from 0 to 100 then counting the MEAN values. | Data were normally distributed and using one-way repeated measures ANOVA test |
| Engagement-User engagement scale short form | Converting to a total score of 0-100 then counting the MEAN values | Data were not normally distributed and using the Friedman’s test and Wilcoxon test |


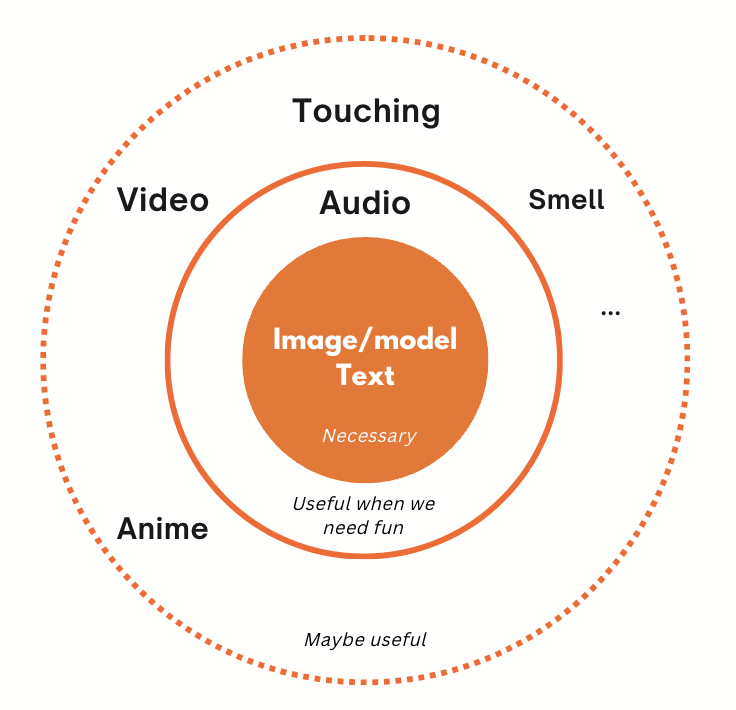
Research finds that graphic and textual elements are a necessary part of AR design. However, the presence of sound can be distracting to some extent and can negatively affect the user’s understanding of the artifact.
Research finds that graphic and textual elements are a necessary part of AR design. However, the presence of sound can be distracting to some extent and can negatively affect the user’s understanding of the artifact.
The rest of the AR prototype interactions, except for the control group prototype1, can be viewed in the videos.